Below are the statistics of Passengers, Cargo and Aircraft movements in top airports of the world in year 2020 vs 2021. The report has obtained from Airports Council International (ACI), the trade association of the world’s airports,
Passenger traffic
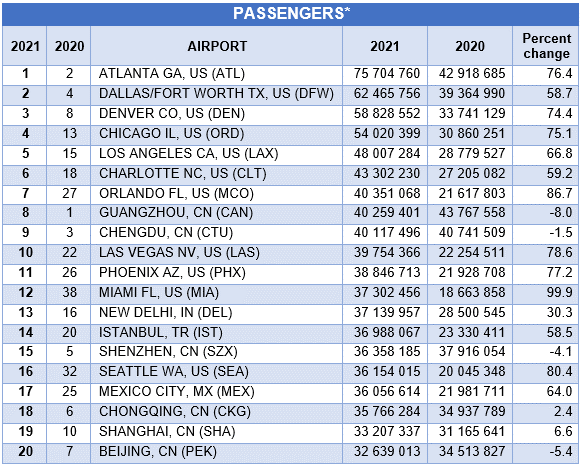
In 2021, the world’s airports accommodated 4.6 billion passengers, representing an increase of 28.3% from 2020 or a drop of 49.5% from 2019 results. The top 20 airports, representing 19% of global traffic (863 million passengers), experienced a gain of 42.9% from 2020 or a drop of 31.9% versus their 2019 results (1.27 billion passengers in 2019).
Hartsfield-Jackson Atlanta International Airport (ATL, 75.7 million passengers, +76.4%) is back on the top of the 2021 rankings followed by Dallas Forth Worth (DFW, 62.5 million passengers, +58.7%) and Denver (DEN, 58.8 million passengers, +74.4%). From the top 20 rankings, almost all airports have significant domestic traffic representing 65% to 100% of their total passengers. The only exception is Istanbul International Airport (IST) with a larger international traffic share (72% of passenger traffic).
The statistics shows that in year 2021, in an average, Atlanta airport was host of 207,401 passengers on daily basis, meaning 8,642 person per hour and 144 person per minute.
The statistics shows that in year 2021, in an average, Atlanta airport was host of 207,401 passengers on daily basis, meaning 8,642 person per hour and 144 person per minute.
Air Cargo
Air cargo volumes increased by 15.4% year-over-year (+4.5% versus 2019), to a record 125 million metric tons in 2021. Air cargo volumes in the top 20 airports, representing around 44% (54.8 million metric tons) of the global volumes in 2021, gained 14.7% in 2021 year-over-year or 13.4% versus 2019. The gain can be attributed to improved economic conditions that drove an increase in demand for consumer goods and pharmaceutical products (such as personal protective equipment and vaccines).
Hong Kong (HKG, 5.0 million metric tons, +12.5%) regained top rank from Memphis (MEM, 4.5 million metric tons, -2.9%) who inched back to second position, followed by Shanghai (PVG, 4 million metric tons, +8.0%) in third. Compared to pre-pandemic levels, the biggest jump in the top 20 rankings was recorded for Chicago’s O’Hare International Airport (ORD), which improved its position by seven spots, from 18th in 2019 to 11th in 2021.
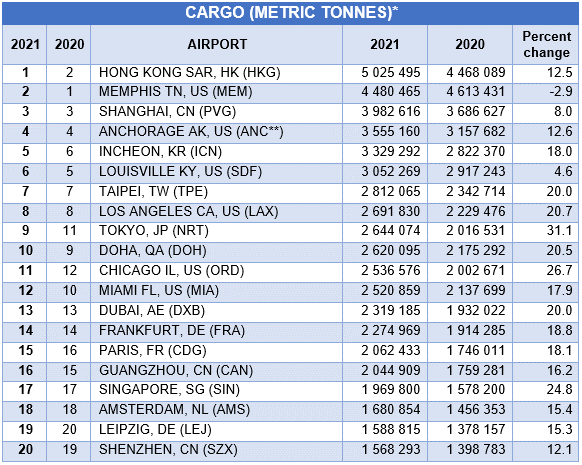
The figure shows that in year 20201, in an average, every day Hong Kong airport had 13,768,479 KG cargo. It means that every hour 573,686 KG and every minute, 9,561 KG cargo was landed or departed from HKG airport.
Aircraft movements
2021 global aircraft movements are close to 74 million, representing a gain of 18.7% from 2020 results or -28.2% versus 2019. The top 20 airports, representing 12% of global traffic (8.7 million movements), witnessed a gain of 27.9% from their 2020 results or a drop of 15.7% vis-à-vis their 2019 results (10.3 million in 2019).
ATL is at the top with 708 thousand movements (+29.1% from 2020) but still below its 2019 result of 904 thousand movements (-21.7%). ORD is still in second rank after leading ATL in 2019 and 2018.
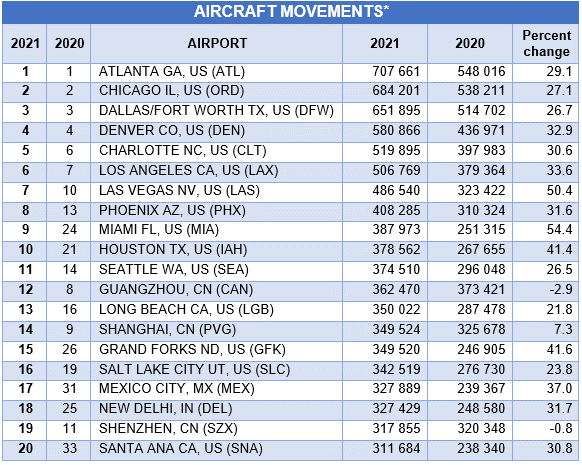
The statistics shows that in year 2021, in an average, Atlanta airport was a home of 1938 landing or departure every day, resulted in almost 81 flight per hour or, 1.35 flight per minute.